Demonstration — synthetic data

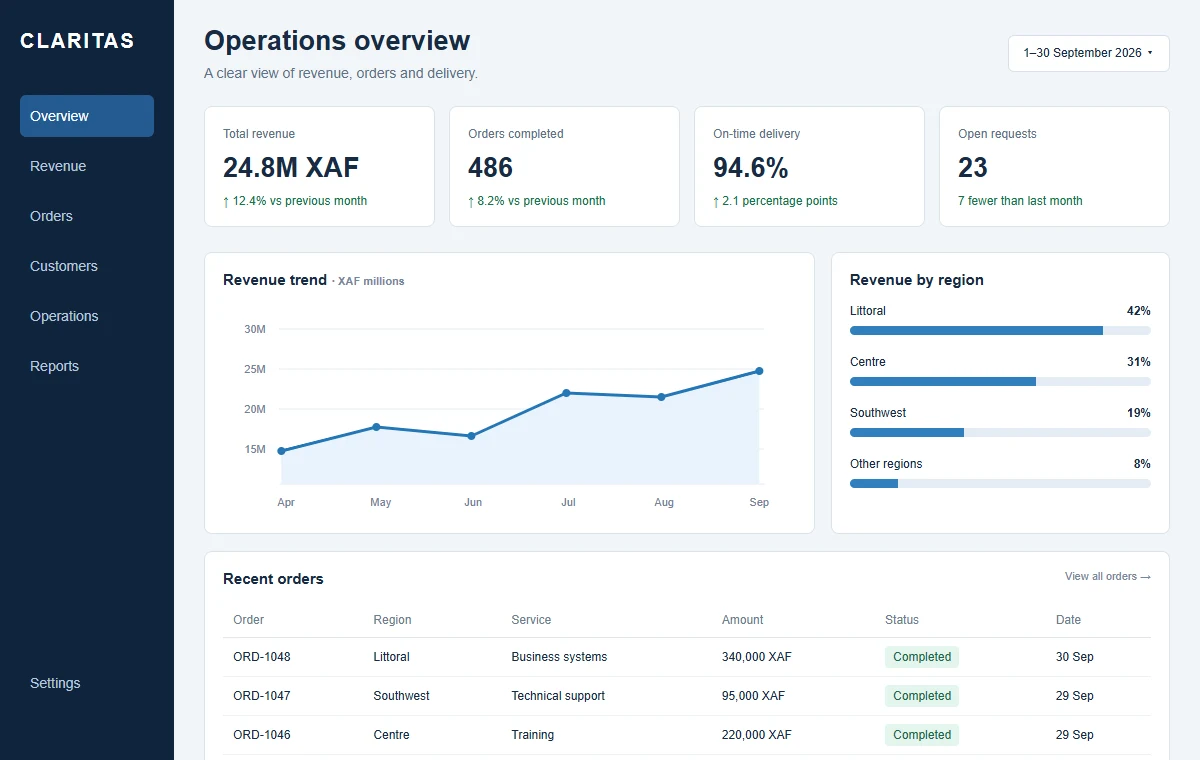
Operations Insight Dashboard

A management-view concept that brings operational status, exceptions and data-quality context into one interface.

Demonstration — synthetic data: This dashboard demonstration uses synthetic illustrative data. It does not contain client information or represent achieved business results.
Operations dashboard with a revenue chart, regional breakdown and order table

Service operations control view

A synthetic queue, status and exception concept for teams coordinating requests across locations.
Inventory and sales signals

An illustrative stock, demand and replenishment view that keeps freshness and definition cues visible.

Cash-flow scenario monitor

A non-financial-advice demonstration for comparing expected inflows, commitments and timing scenarios.

Explored challenge

Leaders may receive delayed reports with conflicting definitions and little indication of missing or stale source information.

Demonstration direction

The interface pairs agreed measures with definitions, freshness cues and exception drill-downs so the limits of the view remain visible.

Scope

  • Synthetic operations data model
  • Summary, trend and exception views
  • Data freshness and quality indicators
  • Responsive dashboard interaction

Key features

  • Filterable operating view
  • Metric definitions beside values
  • Exception-focused detail
  • Visible synthetic-data disclosure

Technologies

  • Synthetic data
  • Analytical modelling concept
  • Responsive data visualisation

Expected value if implemented with governed data

A trusted operational view could shorten reporting preparation and make exceptions easier to investigate, but value depends on source quality, ownership and adoption

Discuss a dashboard