Data Analytics & Business Dashboards

Turn scattered spreadsheets and system records into dependable business dashboards. We help your team define metrics, improve data quality and build reporting around real decisions.

What we provide

Illustrative scene: data analysis and dashboard graphs

Important information is often split across spreadsheets and systems, definitions conflict, and reports take too long to prepare or are difficult to trust.

  • Data and reporting maturity assessment
  • Data preparation, modelling and quality rules
  • Dashboard and management-report design
  • Analytics workflow and KPI definition
  • Data governance and documentation

We work backward from the decision, establish shared definitions and ownership, then build an appropriate data pipeline, model or dashboard with validation built in.
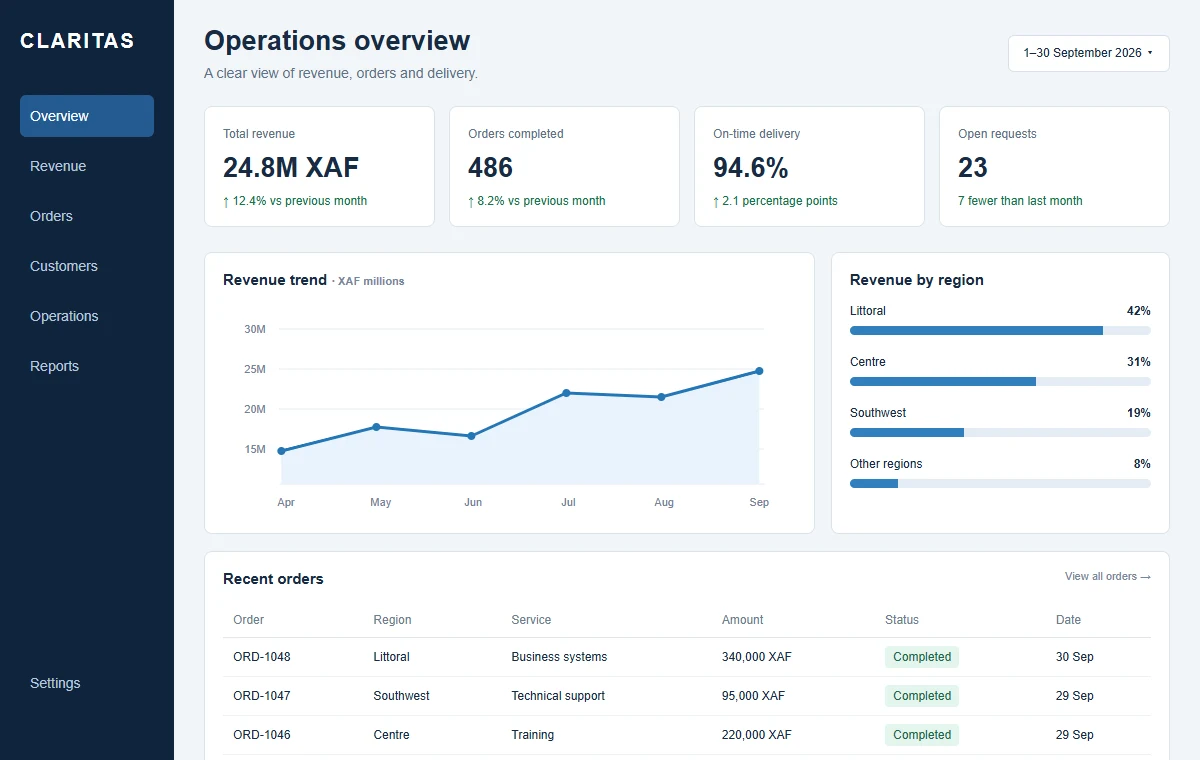
Illustrative scene: an operations dashboard with revenue, orders, regional performance and a transaction table

Who it helps

  • Teams dependent on manual spreadsheet reporting
  • Organisations consolidating data from several tools
  • Leaders who need a clearer operational view
  • Startups preparing an analytics-ready product foundation

Intended outcomes

  • Shared definitions for priority measures
  • More repeatable reporting workflows
  • Clearer visibility into data quality issues

Scope, prerequisites and handover

Before work starts, we agree the users, authorised access, deliverables, budget and acceptance criteria. Documentation, user handover and support are defined in the proposed scope; licences, equipment and third-party fees are identified separately.

From Limbe, we support SMEs, startups and teams in Cameroon and assess remote engagements for international clients, including the United States. On-site work depends on location and prior agreement; an overseas office or local installation service is not implied.

How we work together

Common questions

Can you work with our existing spreadsheets?

Yes. Spreadsheets can be a useful starting source. We assess their structure and risks, then decide whether to improve the existing workflow or move selected parts to a more controlled system.

Do you provide dashboards only?

No. A dashboard is useful only when the underlying definitions, source data and ownership are dependable, so the engagement can include those foundations.

Which analytics platform do you use?

The choice depends on current systems, users, connectivity, governance and budget. We avoid selecting a platform before those constraints are understood.